V. Generalization
I. Learning from examples
Generalization
The main goal of a machine learning model is good generalization. This means that after learning from the training data, the model can generalize what it has learned and make accurate predictions on data it has never seen before (i.e., unseen data). We say a model generalizes well when it accurately predicts the test set results.
Does our decision tree model also classify new monkeys well? Let's check.
The caretaker has sent us additional data for testing. Below we have these new test data provided by the caretaker. On the left we see the new monkeys that do not bite, and on the right the new monkeys that do bite.
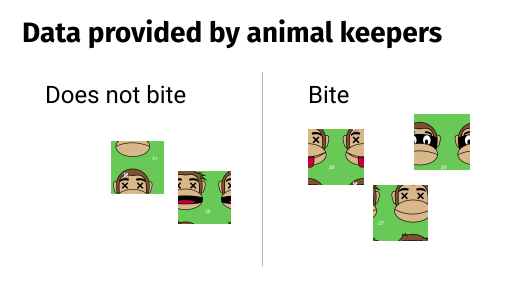
Now we use our trained model to test whether the new monkeys are predicted correctly. Below you can see the resulting classification based on our decision tree.
Decision Tree for Monkey Classification

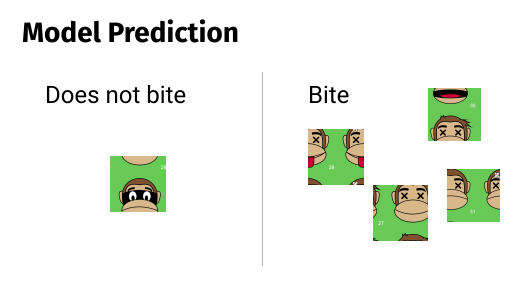
Compare the model predictions with the data provided by the caretaker. Based on this comparison, perform the following activity. Drag the new monkeys into the correct field.
It seems that our models cannot generalize well to unknown, new data, right? What can we learn from this? A machine learning model learns the patterns of the training data and may not perform well on unknown, new data. The performance of a model is limited by the quality and quantity of the data used for training. Care must be taken to collect or obtain high-quality data that can represent the target population.
How do AI developers typically check whether their models are highly accurate?
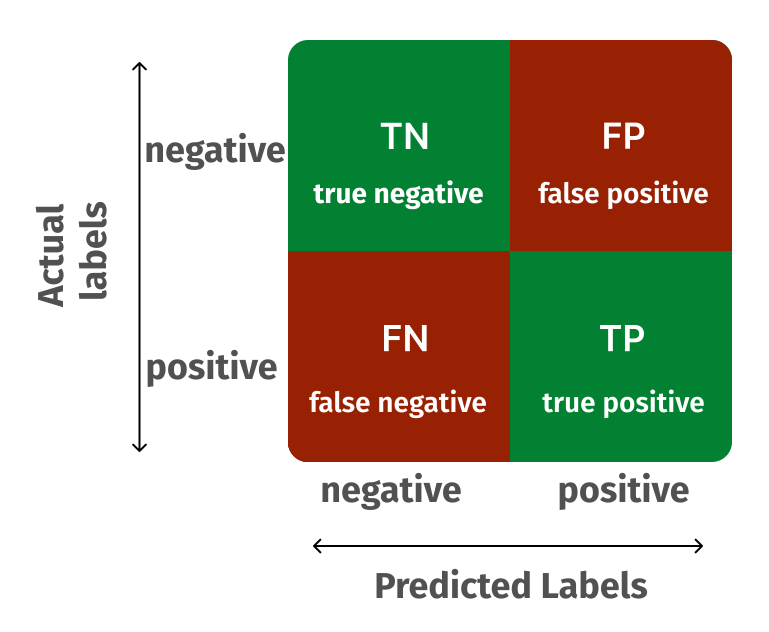
The actual labels are arranged in the rows (vertical), while the labels predicted by the model are shown in the columns (horizontal).
A quick assessment of this matrix is done by looking at the elements on the main diagonal from top left to bottom right. Perfect classification shows values only on this diagonal, while all other cells are zero (i.e., no false positives and no false negatives).
 Accuracy :
A common metric to evaluate the performance of a classification model is accuracy. It can be calculated using the confusion matrix and describes how well the model labels all cases correctly. The higher the proportion of true positives and true negatives out of the total cases, the higher the model’s accuracy.
